Home/Blog/The 5 to 15% Hiding in Your Subcontractor Tender
Deep Dives · 2 July 2026 · Hashan Senarathna
The 5 to 15% Hiding in Your Subcontractor Tender
The Intelligence Deep Dive 07 | Issue 014 | 2026 — a Hashan Senarathna deep dive.
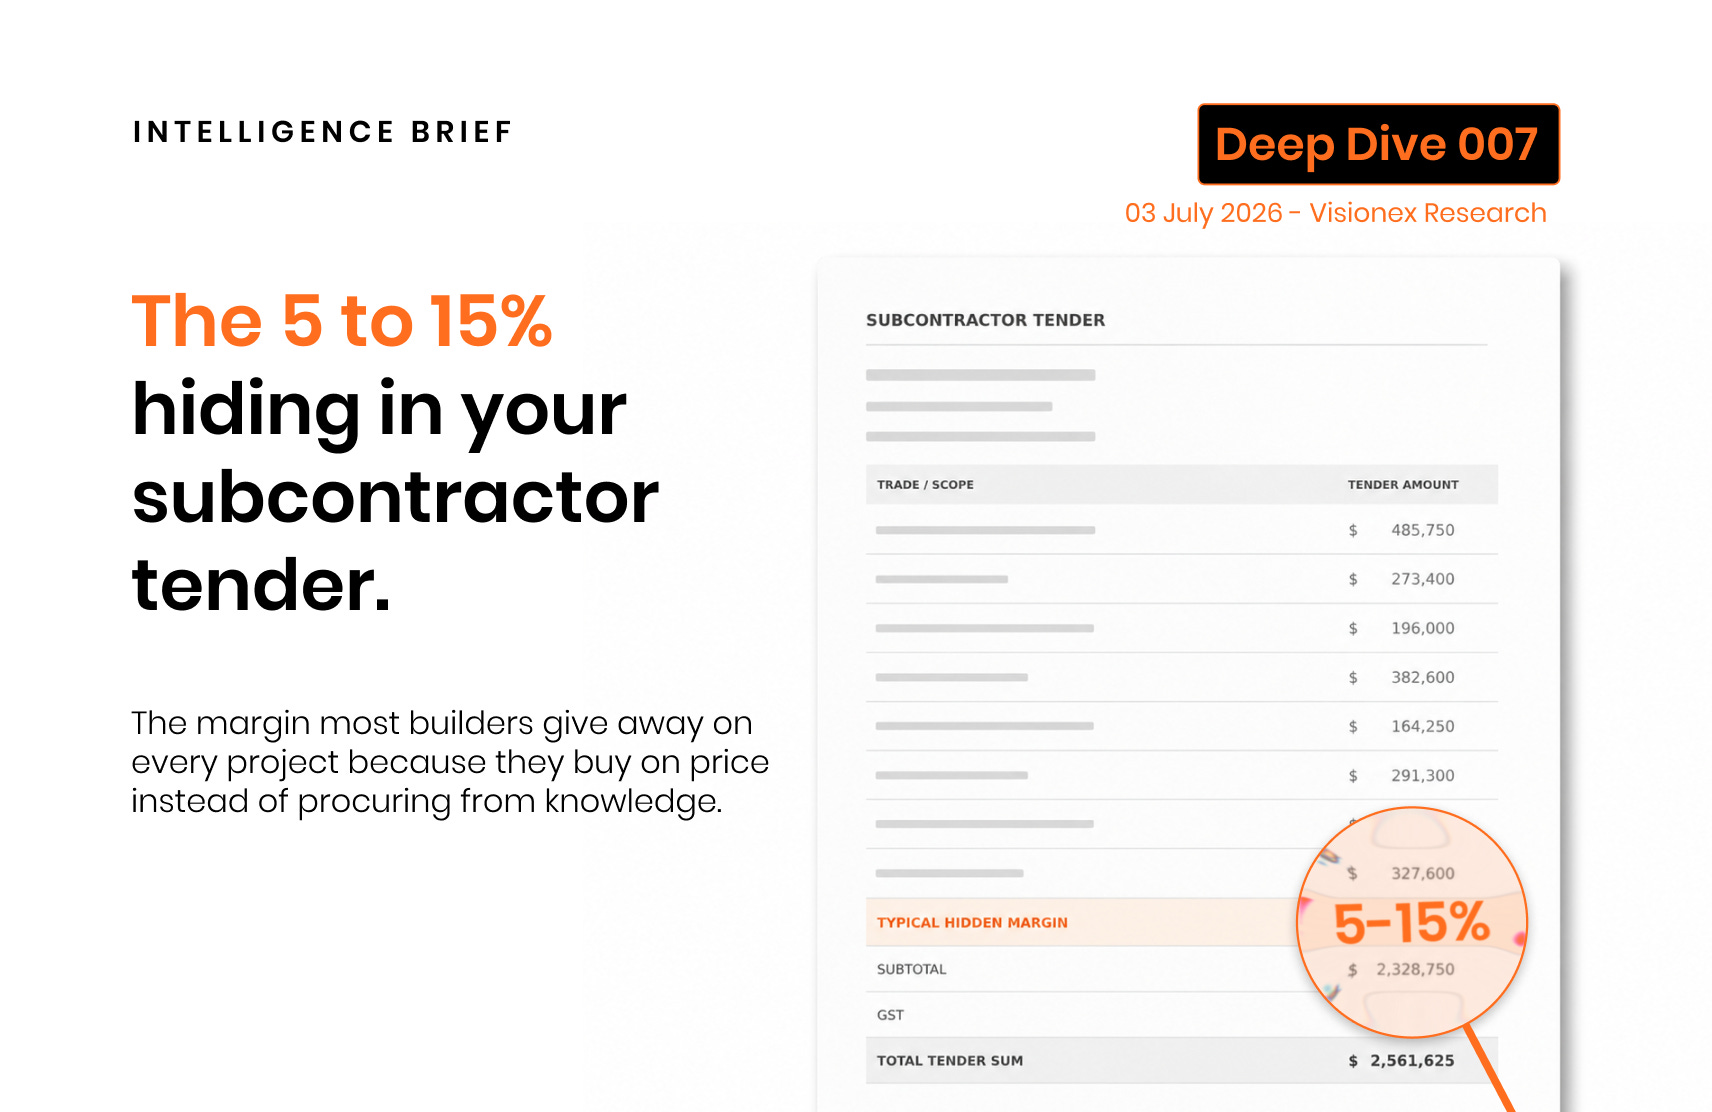
Two builders tender the same $30 million project, in the same market, with the same trades available. One finishes with $1 million to $3 million more margin than the other. The design did not change. The market did not change. The only difference was how they bought the single largest cost line on the job. This chapter is about that difference.
Over the past six chapters, this brief has set out the structural pressure on Australian construction: a $350 billion pipeline the system cannot fully deliver, a cost base that will not reset before 2028, a housing federation fracturing along state lines, a delivery ceiling approaching across labour, contractors and procurement bandwidth, a subcontractor insolvency cascade that starts below the headlines, and a cash architecture that separates surviving builders from the ones being swept up in it.
That diagnosis is complete. The question it leaves open is the commercially decisive one: under that pressure, which firms come out of 2027 materially stronger, and what specifically do they do differently?
This chapter opens the second pillar of the answer. Procurement intelligence.
Here is the tension most of the industry has not confronted. The largest single cost line in Australian construction is subcontractor spend. For most builders, it represents 60 to 80% of delivered project cost. It is also the cost line the industry manages with the least sophistication. Most builders receive three to five quotes, pick the lowest number, and move on. They call that procurement. It is not procurement. It is administration.
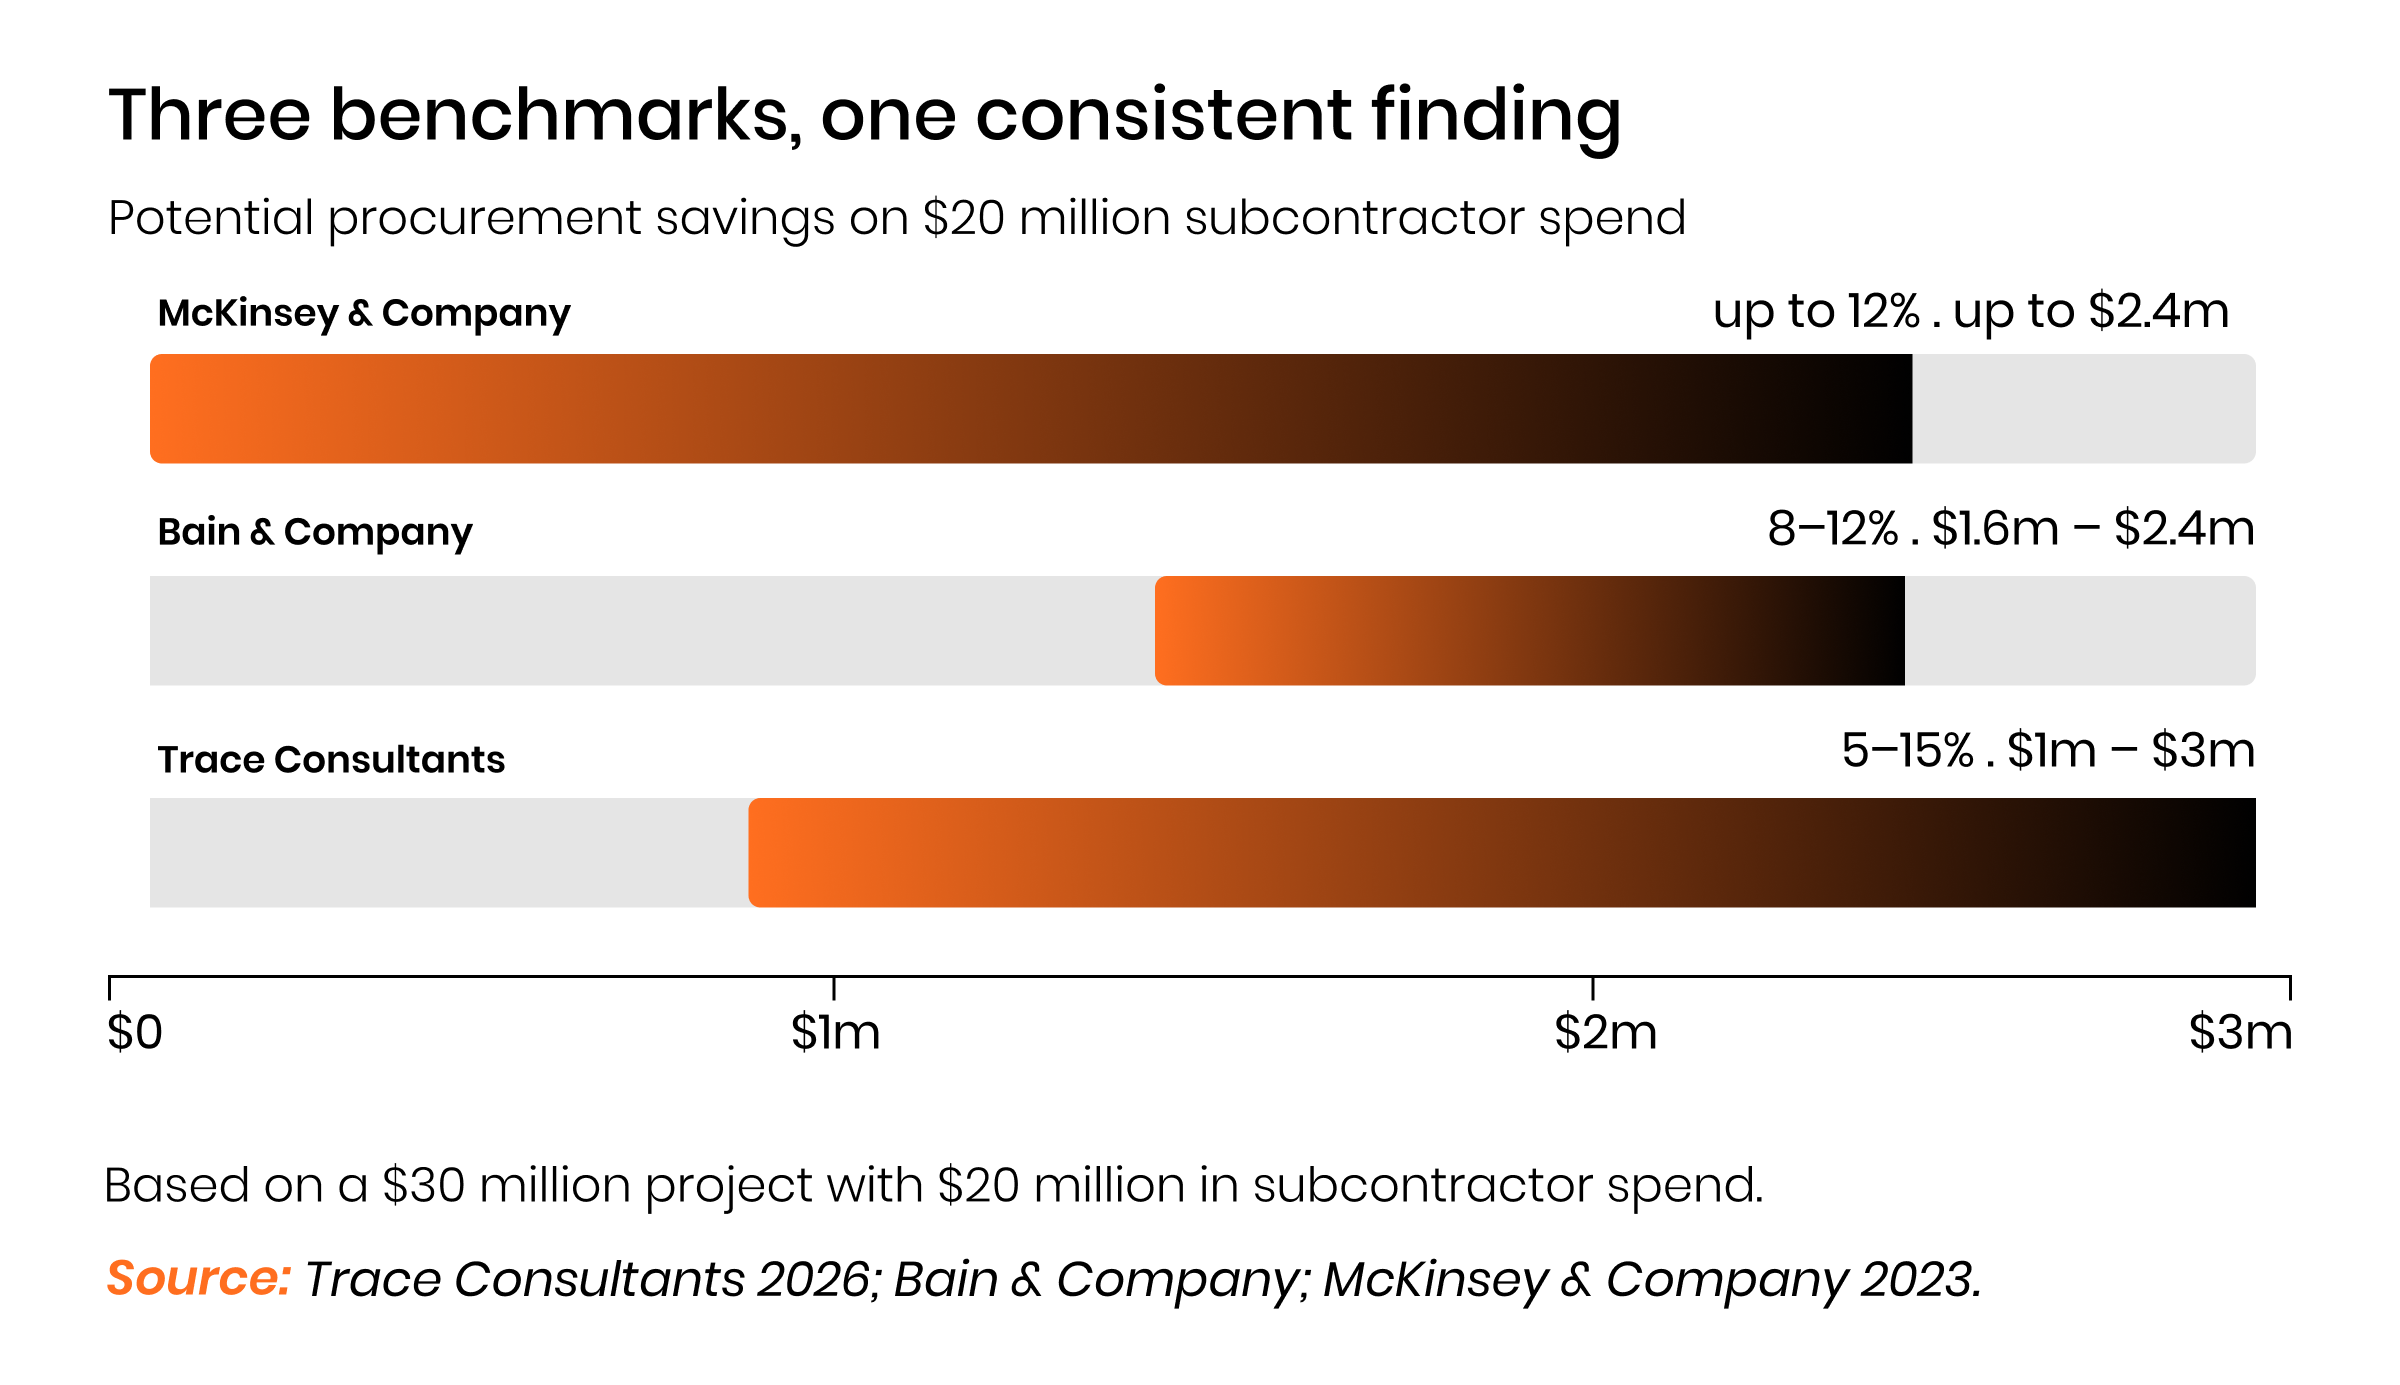
The research is consistent across three independent sources. McKinsey’s 2023 construction procurement study found that firms with best-in-class procurement practices operate at margins 5 to 10 percentage points higher than procurement laggards, and that consistent application of those practices generates savings of up to 12% of procurement spend. Bain & Company’s global procurement transformation research puts initial savings at 8 to 12% of total purchasing costs, with 3 to 4% reaped annually thereafter. Trace Consultants, an Australian procurement and supply chain advisory firm, benchmarks well-executed strategic procurement programmes at 5 to 15% savings on addressable spend.
Three firms. Three methodologies. The same finding. Somewhere between 5 and 15% of what Australian builders pay their subcontractors is margin they are giving away because they do not have the data, the systems or the discipline to negotiate from knowledge.
On a $30 million residential project where subcontractor packages make up $20 million of delivered cost, that range translates to $1 million to $3 million. Not over a portfolio. On a single job.
That is the number this chapter unpacks.
1. Procurement accounts for most of the money. It gets almost none of the attention.
Start with the structural fact that frames everything else.
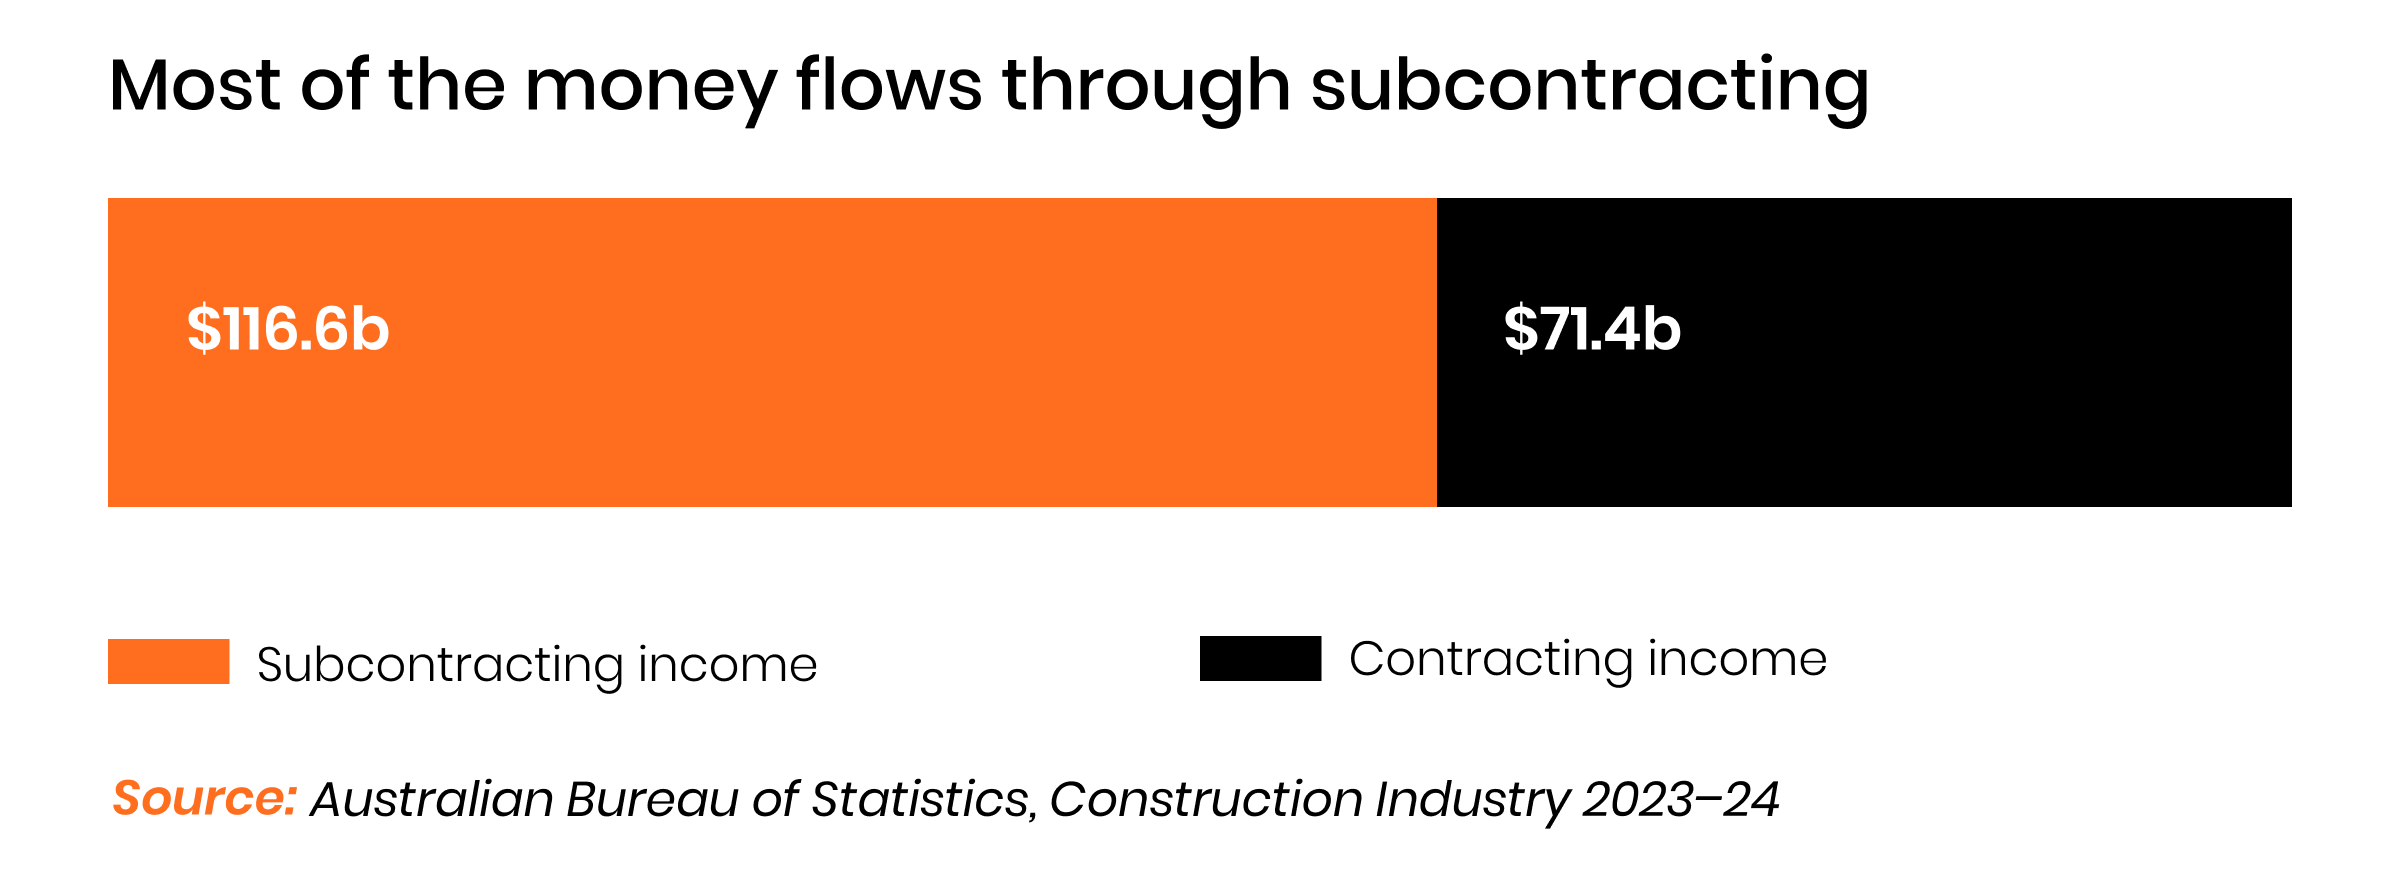
The Australian Bureau of Statistics (ABS) recorded total construction industry income of $633.6 billion in 2023-24. Within the Construction Services subdivision, the segment that covers specialist trades and subcontractors, subcontracting income was $116.6 billion, compared with $71.4 billion in primary contracting income. That is not a minor cost line. Subcontracting is how most of the construction work in Australia gets priced and delivered.
The proportion has been consistent for over a decade. ABS data from 2011-12 showed that 40.1% of total construction industry income came from subcontracting, rising to 79.1% for the Construction Services subdivision specifically. Infrastructure Australia’s 2025 Market Capacity Report confirmed the pattern at the project level: 41% of infrastructure construction is delivered through subcontracting arrangements, which the report identified as a source of interface risk and reduced self-performance by Tier 1 contractors.
McKinsey’s 2023 study put the figure in global terms: procurement accounts for 40 to 70% of a construction company’s total spending. For Australian builders operating at the higher end of subcontractor reliance, the proportion sits closer to 70%.
That is the cost line. Now consider how most of the industry manages it.
McKinsey’s Global Purchasing Excellence Survey ranked construction in the lower range of procurement sophistication across all industries surveyed. The sector that spends the most on procurement manages it with the least rigour. That gap is not an accident. It is a structural feature of how the industry evolved: fragmented, project-based, time-pressured, and historically focused on winning work rather than optimising how that work gets bought.
The consequence is measurable. In an industry where net margins for residential builders commonly sit between 2 and 5%, a procurement discipline that recovers even 5% of subcontractor spend does not improve the margin. It transforms it.
2. What the firms doing this differently actually look like
The difference between a builder who procures and a builder who buys is not technology. It is knowledge.
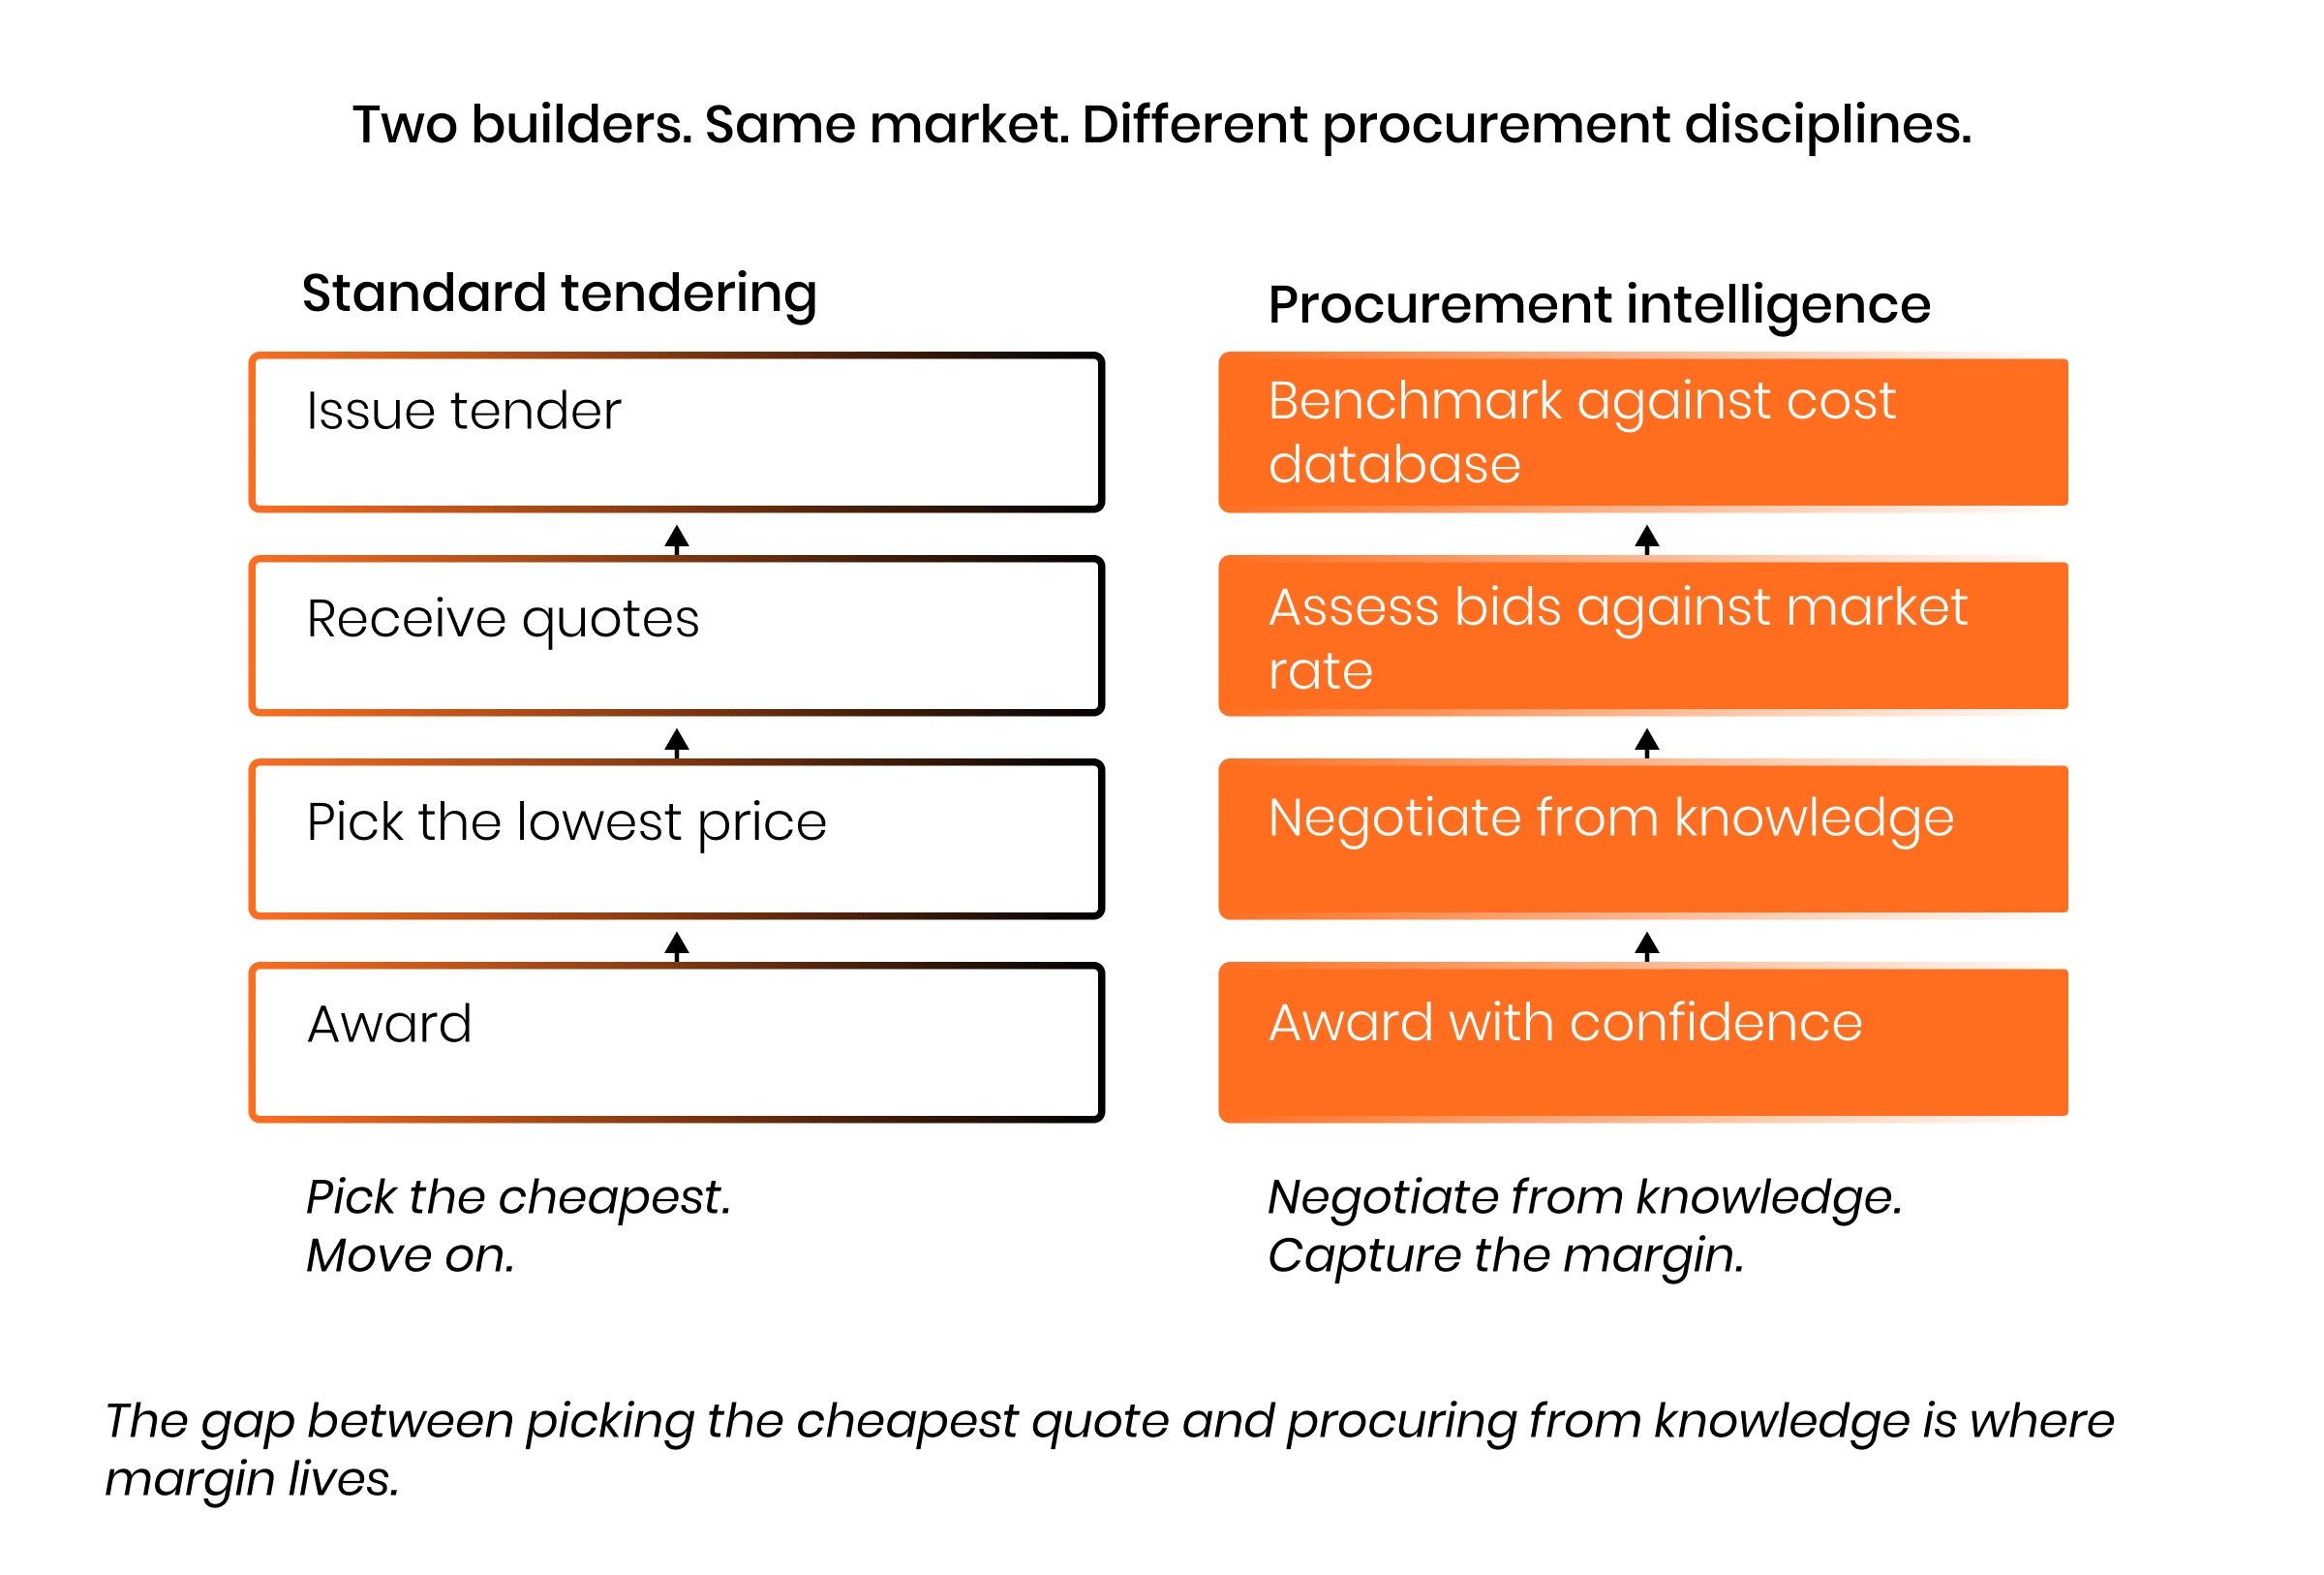
A builder who buys receives quotes, compares them on price, and awards the package. The information set is the tender itself. The benchmark is whatever came in lowest. The negotiation leverage is close to zero because there is nothing to negotiate against except the other quotes on the table.
A builder who procures does something structurally different. They maintain records of subcontractor pricing across projects, trades, regions and contract types. They know what the market rate is before they open the first envelope. They understand which trades have capacity right now, which subcontractors are hungry for work, which payment terms unlock sharper pricing, and where the quote they are reading sits against the historical distribution for that trade and scope.
McKinsey identified the single biggest separator between strong-performing and weak-performing construction firms on procurement: the in-house cost database. Strong performers, McKinsey found, maintain a cost database that incorporates quotes from new construction and existing facilities. They scrutinise the factors behind costs, constantly update their databases, and perform bottom-up estimates for core packages. The database is not a technology product. It is an institutional memory that compounds over time. Every project feeds the next one. Every quote received becomes a data point that informs the next negotiation.
Trace Consultants’ 2026 analysis of the Australian construction market makes the same point from the advisory side. Organisations that treat procurement as an administrative process, issuing tenders and selecting the lowest price, are the ones experiencing cost blowouts, programme delays and contractor failures. The organisations delivering projects successfully in 2026 are the ones that treat procurement as a strategic function. They invest in market intelligence, adapt their approach to conditions, and recognise that in a capacity-constrained market, the quality of the procurement strategy is as important to project success as the quality of the design.
Consider a practical example. A mid-tier Sydney builder tendering a 60-unit apartment project receives five hydraulic packages. The lowest quote comes in at $1.4 million. Without historical data, that number is the benchmark. The builder awards the package. But a builder with three years of project-level hydraulic cost data across similar Sydney mid-rise projects knows that hydraulic packages of this scope have historically ranged between $1.15 million and $1.5 million, that the current market has softened slightly in this trade due to a slowdown in high-rise starts, and that two of the five bidders are carrying light order books. That builder does not accept $1.4 million. They negotiate. Not aggressively. From knowledge. The outcome is a sharper price, better payment terms, or both.
Multiply that across every trade package on a project, then across a portfolio of projects, and the margin effect is not incremental. It is structural.
3. The hidden cost most builders do not know they are paying
The procurement intelligence story has a second layer that most of the industry has not priced. It is not about negotiating harder. It is about the premium builders pay when their own payment reputation works against them.
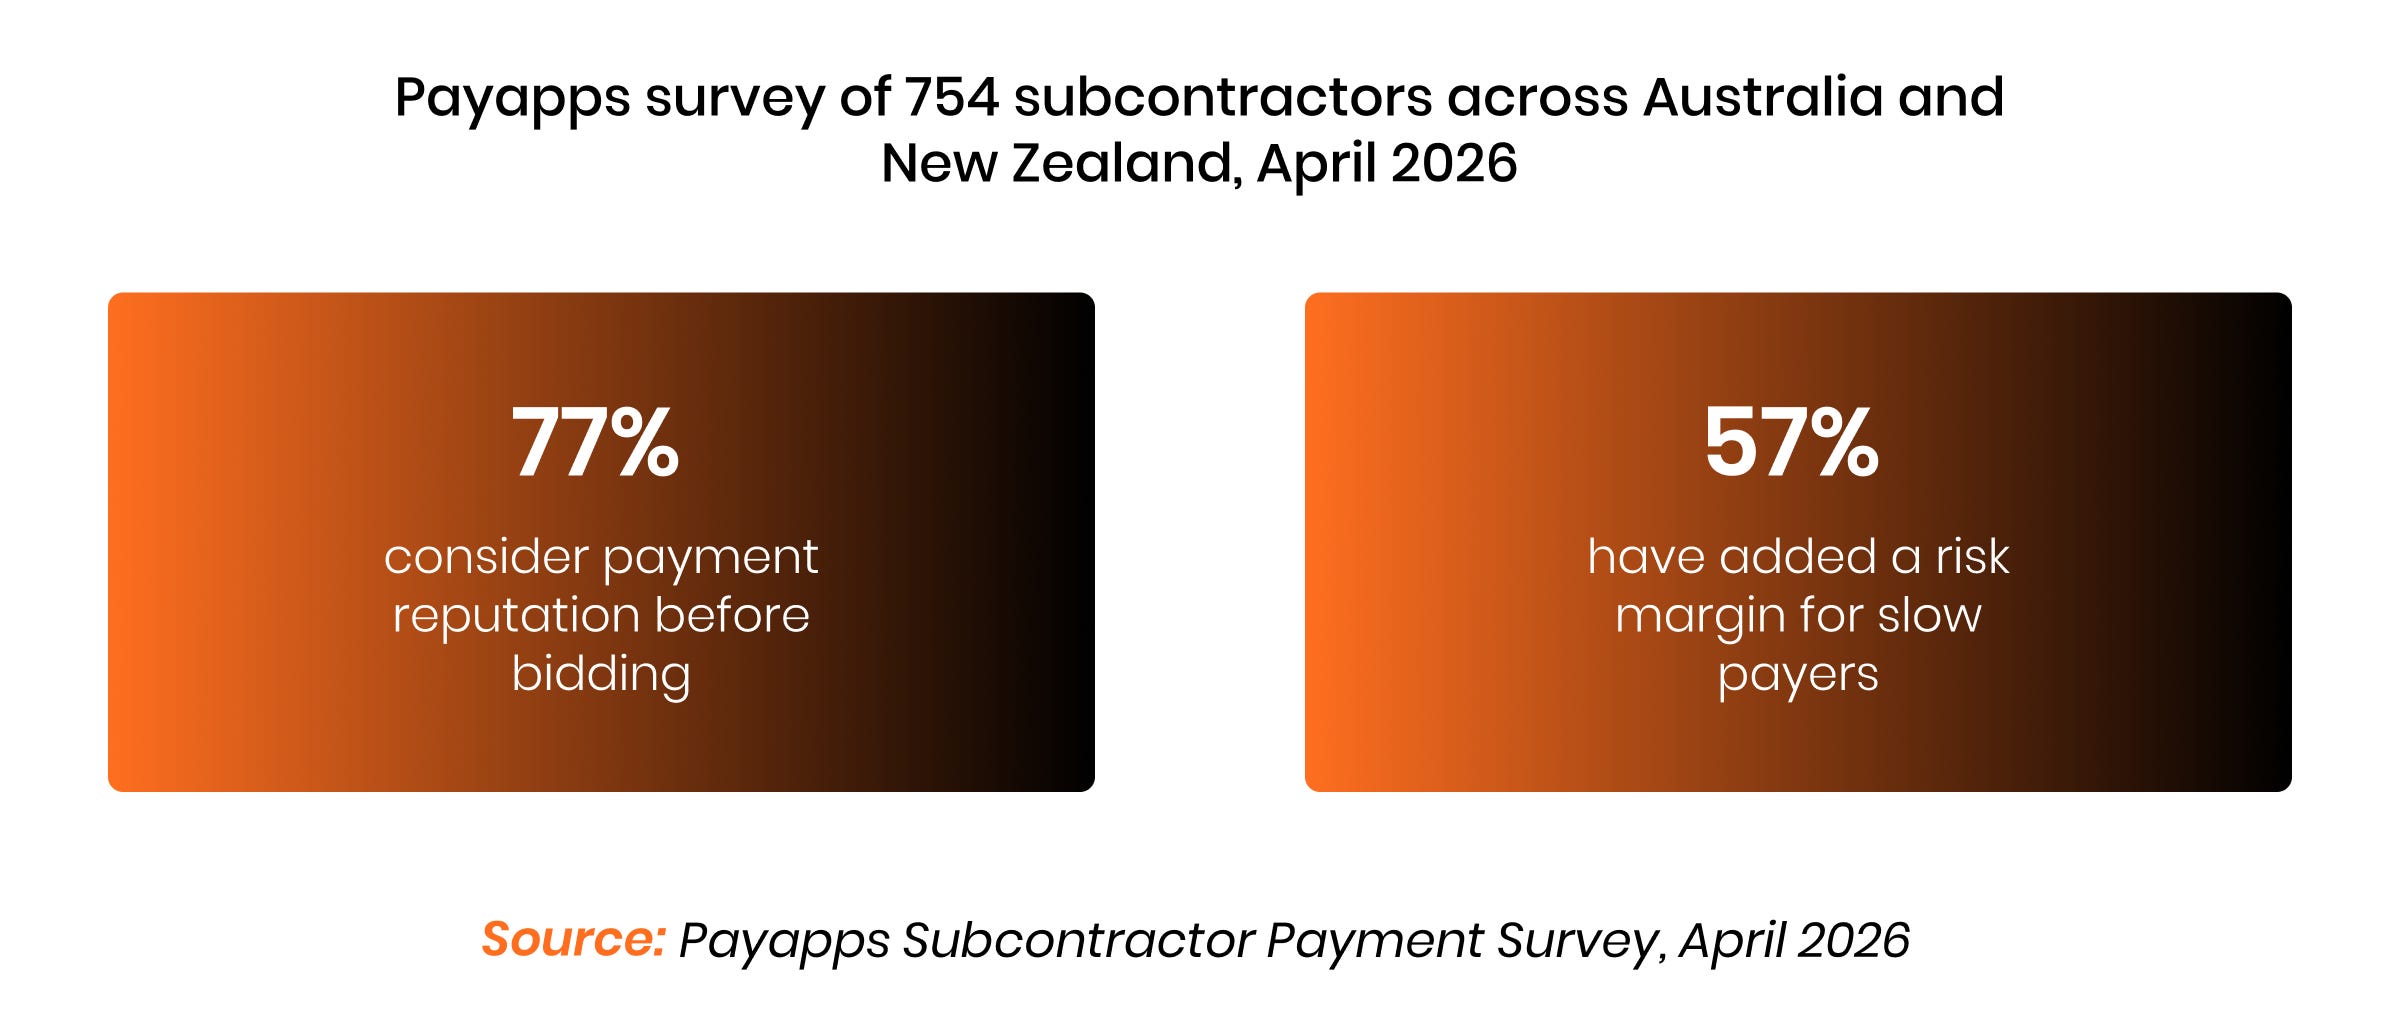
A Payapps survey of 754 subcontractors across Australia and New Zealand, published in April 2026, produced two findings that should reframe how every builder in the country thinks about procurement.
First, 77% of subcontractors said a main contractor’s payment reputation influences their decision to bid or price future work. Second, 57% said they have increased their rates or added a risk margin specifically because of slow or unreliable payments.
Read those numbers together and the commercial mechanism becomes clear. When a builder pays late, subcontractors do not simply absorb the cost. They price it. They add a buffer to cover the cash flow gap, the financing cost, the risk of non-payment, and the stress of chasing money they have already earned. That buffer sits inside every quote the builder receives. It is invisible in the tender comparison. It is very real in the project margin.
The inverse is equally powerful. A builder known for reliable, fast payment attracts sharper pricing from the same subcontractors who are loading premiums onto slower-paying competitors. The subcontractor’s logic is rational. A dollar earned in 14 days is worth more than a dollar earned in 90 days, and they price accordingly.
The same Payapps survey found that when payments are delayed, the top three impacts on subcontractors are tighter cash flow, increased stress and pressure, and greater difficulty paying suppliers. 40% of respondents said they would be interested in an optional early payment arrangement for approved progress claims, even if it meant receiving a slightly reduced payment. That finding alone tells you how acute the cash pressure is.
The structural data reinforces why this matters now. The CreditorWatch Business Risk Index for May 2026 recorded construction invoices more than 60 days overdue at 7.15% of all invoices, one of the highest rates of any industry. In a market where Australian Securities and Investments Commission (ASIC) data shows 3,217 construction insolvencies in 2024, a 26% rise on the prior year, payment reputation is not a soft measure. It is a pricing input.
The builder who does not know what premium their payment reputation is costing them on every tender is carrying a procurement cost they have never measured.
4. More bidders per project. Less intelligence per bid.
The current market has created a paradox that makes procurement intelligence more valuable, not less.
EstimateOne platform data shows each project now attracts between 12 and 15 subcontractor submissions on average, up from 8 to 10 a year ago. Trades such as electrical, plumbing and interior finishes tend to have the highest number of bidders per job. On the surface, more competition should mean lower prices. The textbook says so.
The reality is more complicated. Rising bid volumes reflect a market where subcontractors are casting wider nets because their own pipelines are less certain. Construction insolvencies running at record levels have thinned out parts of the subcontractor base. Surviving firms are bidding on more work to maintain throughput. The result is a tender environment with more noise and less signal. A procurement team without market intelligence is now comparing 12 to 15 bids with no reliable way to distinguish a sharp price from a distressed price, a competitive offer from one that has been loaded with contingency to protect against the next late payment.
Rider Levett Bucknall’s (RLB) 2026 market update captured the environment directly: skilled labour shortages, low productivity, insolvency risks and limited competition among Tier 1 contractors and subcontractors are contributing to persistent pricing pressures and procurement challenges.
The paradox is that more bids create an illusion of competitive tension without the underlying substance. A builder who receives 14 hydraulic quotes and picks the lowest is not necessarily getting a competitive outcome. They may be selecting a subcontractor who has underpriced the job to win volume, who will later seek variations to recover margin, or who is financially stressed and may not complete the work. The bid comparison spreadsheet does not reveal any of that. Market intelligence does.
This is where the procurement discipline described in Section 2 changes the game. A builder with a cost database and trade-level market knowledge can look at 14 bids and identify the three or four that sit within the realistic range for the scope, assess which of those bidders has the financial stability and capacity to deliver, and negotiate with confidence rather than hope. That is a fundamentally different procurement process, and it produces a fundamentally different commercial outcome.
5. The digital adoption gap: a minority already has the advantage
One of the most commercially significant findings in the current Australian construction data is how unevenly digital procurement capability is distributed across the industry.
The Autodesk and Deloitte 2025 State of Digital Adoption in the Construction Industry report found that 37% of Asia-Pacific construction firms were integrating artificial intelligence or machine learning into their workflows, a significant jump from 26% in 2023. The 2026 edition of the same report showed further acceleration for Australia specifically: 52% of Australian construction businesses now use AI and machine learning, and Australian businesses use an average of 7.6 technologies, up from 6.9 in 2025.
Those headline numbers look like broad adoption. They are not. The same research found that the top three barriers remain a lack of digital skills among employees, a lack of allocated budget, and uncertainty about required technical skills. Only 25% of Australian construction businesses offer regular digital skills training.
The commercial implication is a widening gap. A minority of firms, roughly a quarter to a third of the market, have built or are building the data infrastructure that supports genuine procurement intelligence: cost databases, bid analytics, market benchmarking tools, subcontractor performance tracking. The majority have not. The majority are still comparing quotes in spreadsheets, awarding on price, and wondering why their margins are thinner than they expected.
In any other industry, a structural advantage available to a minority of participants would be rapidly competed away as the majority caught up. Construction’s fragmentation, its project-by-project nature, and its chronic underinvestment in back-office capability mean the gap is widening, not closing. The firms that have invested in procurement data over the past three to five years are now compounding that advantage on every project. The firms that have not are falling further behind with every tender cycle.
The Autodesk and Deloitte research quantified the return: for an average construction business in the Asia-Pacific region with US$100 million in revenue, adopting an additional technology is associated with a US$1.14 million increase in revenue and improved project delivery. Procurement technology is not the only contributor to that figure, but it is among the highest-return investments a builder can make because it affects the single largest cost line on every project.
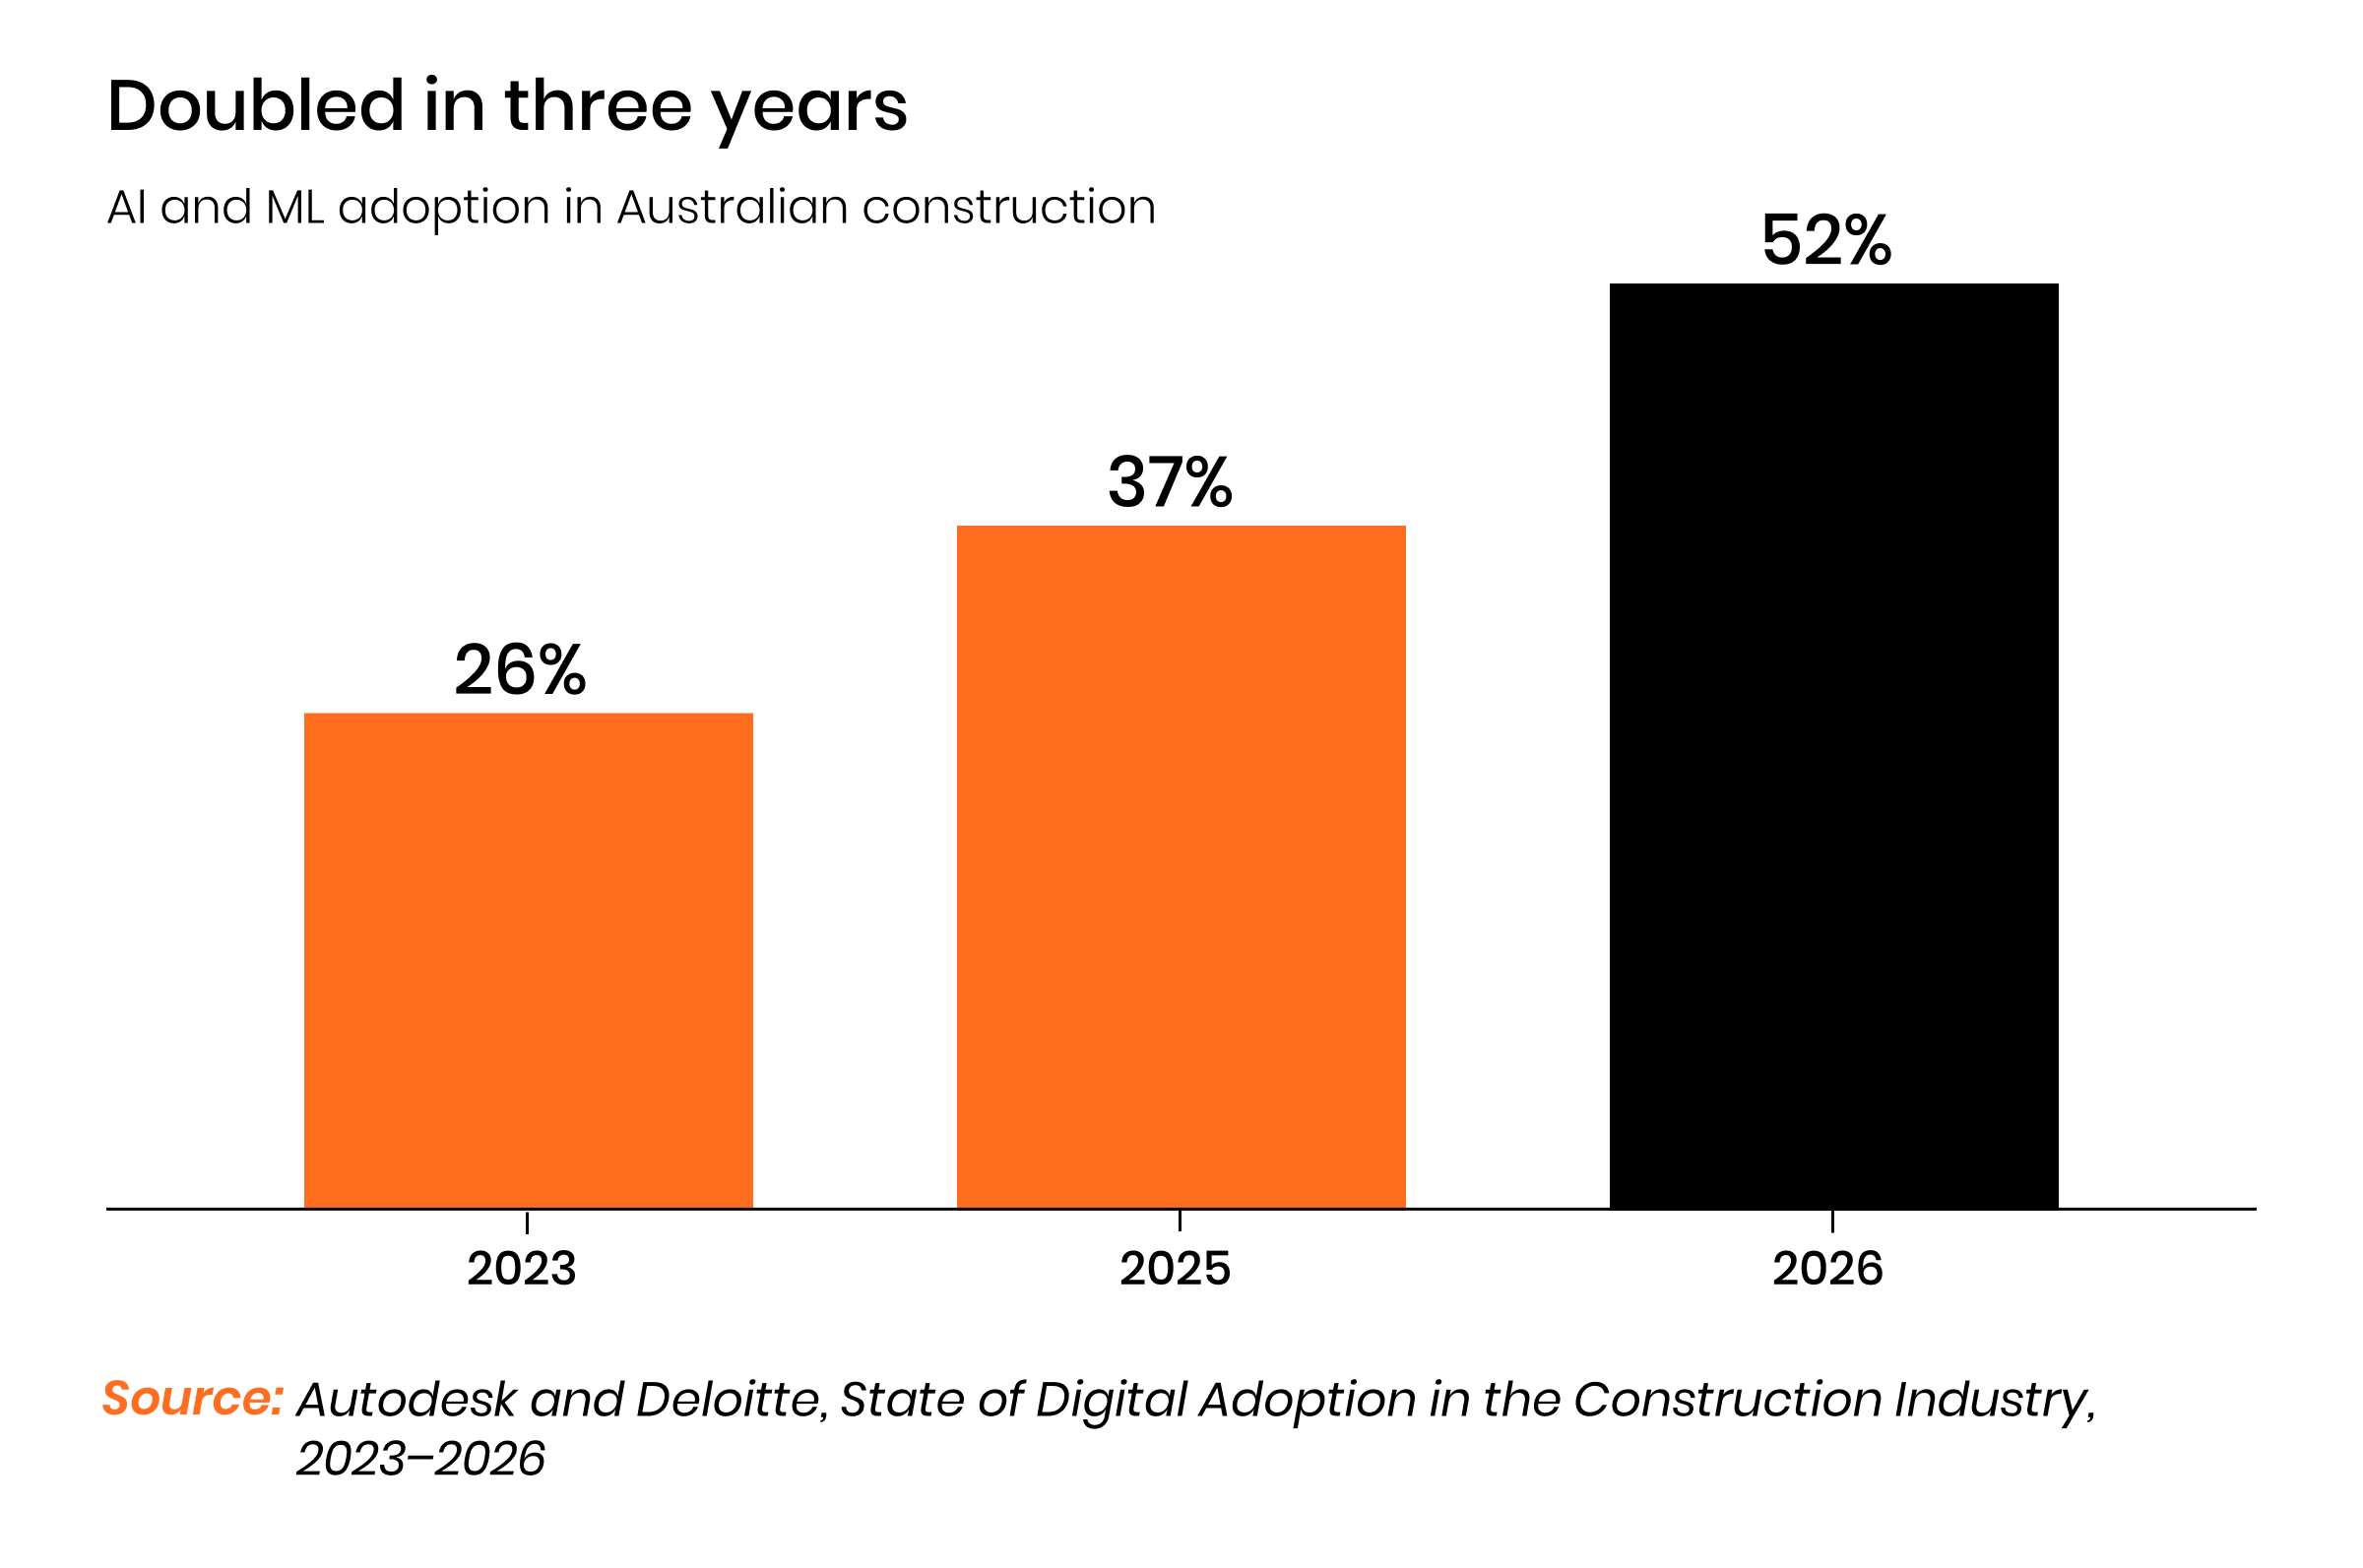
Note: 26% (2023) and 37% (2025) reflect Asia-Pacific-wide adoption across Deloitte/Autodesk’s six-market survey; 52% (2026) is Australia-specific (n=287).
6. The market that makes this urgent
Everything described in the preceding sections becomes more commercially significant in the market Australian construction is operating in right now.
The insolvency environment documented across this series has two effects on procurement. First, it thins the subcontractor base, which reduces genuine competition even as bid volumes rise. Second, it teaches surviving subcontractors to price defensively. A subcontractor who watched three competitors fail in the past 18 months does not bid aggressively. They bid to survive.
The payment environment compounds the pressure. When 57% of subcontractors have loaded risk margins into their pricing, according to the Payapps survey, the cost of poor payment practices is not abstract. It is embedded in every tender a builder receives.
Meanwhile, the infrastructure pipeline identified by Infrastructure Australia continues to absorb trades, project managers and specialist subcontractors from the same pool that residential and commercial builders draw on. RLB’s 2026 outlook confirmed the consequence: delivery risks are rising across skilled labour shortages, low productivity, insolvency risk and limited subcontractor competition.
In this environment, the 5 to 15% procurement savings range is not a theoretical benchmark from a consulting firm’s slide deck. It is the difference between a builder who protects margin through knowledge and a builder who gives it away through habit.
7. What this means if you sit on this pipeline
The procurement intelligence argument resolves into different practical implications depending on where you sit in the market.
For builders and head contractors, the first-order action is to build the institutional cost memory that McKinsey identified as the single biggest separator. That does not require enterprise software or a dedicated analytics team. It requires a discipline: recording every subcontractor quote received, by trade, scope, region and date, and using that accumulating dataset to benchmark future tenders. The builder who starts this on Monday has a meaningful advantage within two to three project cycles. The builder who has been doing it for three years has an advantage that is almost impossible to compete away.
Payment reputation is the second lever. A builder whose subcontractors are loading 5 to 10% risk premiums into every quote because of slow payment is paying for that reputation on every project, invisibly. Shortening payment terms, even modestly, does not just improve subcontractor relationships. It reduces the risk premium built into every tender the builder receives.
For developers and project owners, the implication is in counterparty selection. A developer awarding a head contract to the lowest-priced builder without assessing that builder’s procurement capability is outsourcing the single largest cost variable on the project to the party least likely to manage it well. The builders who procure well deliver tighter margins on subcontractor packages, fewer variations, and more reliable programme delivery. That capability is assessable. It should be assessed.
For subcontractors, the message is that the builders investing in procurement intelligence are the ones most likely to pay on time, negotiate fairly and maintain stable project pipelines. Subcontractors choosing which tenders to price should weight the builder’s procurement discipline and payment reputation alongside the project itself. The Payapps data suggests 77% already do. Payment reputation is already a market signal. It should be treated as one explicitly.
8. Capital View
The margin advantage from procurement intelligence does not appear on a competitor’s balance sheet. It does not show up in annual reports, investor presentations or credit assessments. It shows up in project margins, in tender win rates, and in the absence of variation disputes that erode profitability on delivery.
For institutional developers and project lenders, this creates an asymmetric signal. The builders who have invested in procurement capability, the cost database, the market intelligence, the payment discipline, are delivering structurally tighter project margins than their competitors. That advantage compounds across a portfolio. A 5% procurement saving on one project is a line item. A 5% procurement saving sustained across 15 projects over three years is a competitive moat that reshapes a firm’s market position.
The question for capital allocators is whether they are assessing this capability in their counterparty selection. Most are not. The firms that will come out of 2027 materially stronger are distinguishable now, in part, by whether they treat procurement as a cost centre or a margin engine. That distinction is one of the six pillars this series is profiling. The evidence, from McKinsey, Bain, Trace Consultants and the subcontractor market itself, suggests it may be the pillar with the fastest payback period of all.
Deep Dive 08 turns from how builders buy to how they contract. The average construction dispute now runs to $1.2 million, and 87% of disputes trace back not to the work itself but to the language that defined it: scope left ambiguous, risk left unallocated, terms that were never properly priced. It looks at what the firms that price contract risk deliberately do differently, and why the rest of the market keeps paying for wording it never negotiated.
[Coming in Deep Dive 08: The $1.2M Problem: How Contract Language Causes 87% of Disputes. Publishing 17 July 2026.]
See you next week.
Note: This article is general market commentary and does not constitute financial, legal or investment advice. All monetary figures are in Australian dollars (AUD).
Keep reading
More from the bid team
14 October 2026 · Visionex Solutions
The Call You Should Not Make
Construction runs on relationships: a quick call to the client, a coffee with the project manager, a word on the site walk.
6 October 2026 · Visionex Solutions
How Defence Actually Evaluates
In Defence's final evaluation for the Army's new infantry fighting vehicles, then planned as a fleet of up to 450, Rheinmetall's tendered price was almost...
30 September 2026 · Visionex Solutions
The Bid You Should Not Submit
Defence's standard construction tender form asks you to declare that bidding was your own commercial decision. The question is whether you actually made one.
Have a tender on your desk?
Send it through. Within 24 hours you will have a go or no go call, a returnables check, and a clear view of where the marks are.